
|
What's not to like about a Top 10 list? If you know someone who may enjoy reading about this, please consider forwarding to a friend. Here's the top ten most popular articles and posts in this past year:
I hope you've had a great 2018 and are looking as forward to the coming year as I am.
If you've found any of this helpful, consider sending this to a friend or encouraging them to sign up for these weekly articles here. Thanks in advance and have a great holiday and happy new year! Things are busy around here - despite the PE Prep "offseason" beginning, I've been working on improvements and construction of a handful of promising tools. One basic but very much needed update is an improvement to the Obstruction Calculator. Now, you can enter either the horizontal distance of a sprinkler or the vertical distance of the sprinkler, and get minimum and maximum feedback based on each. During design, many of us know the depth of the sprinkler and depth of the obstruction prior to determining where (horizontally) the sprinkler is going to be located away from an obstruction. Now the tool helps support that effort. 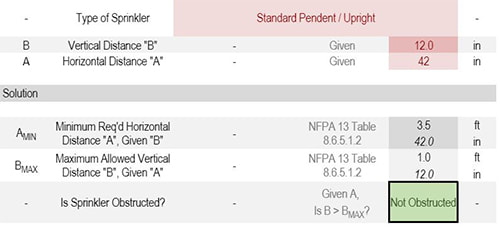 If you're a Toolkit user, you have immediate access to these updates and can download the latest updates on the dashboard here.
As always, thank you to those who have sent ideas and feedback! Stay tuned for next week on a new database launch for Toolkit users. Don't get these articles by email? Subscribe for free here. Based on some feedback and good ideas I've been experimenting with graphing fire pump & flow test curves with usable data outputs. Below is the first iteration for drawing a fire pump curve alongside a water supply curve.  Determining ideal fire pump configurations for sprinkler and standpipe systems can be an important part of optimizing fire suppression design Here's the help I could really use from you - what else would be included in your ideal pump curve?
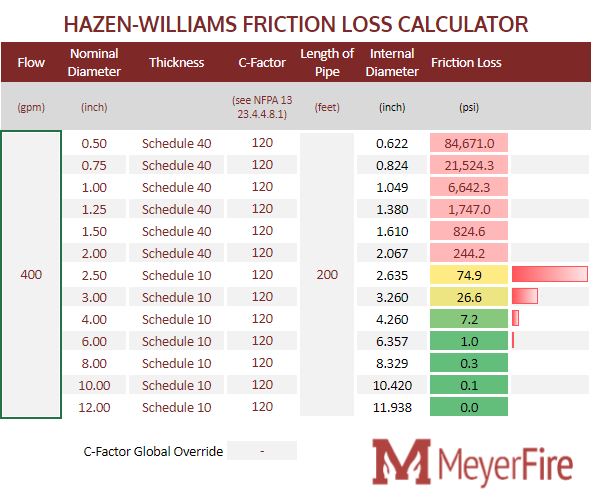
Would you prefer this be on a logarithmic x-axis? Want 175 & 300 psi limit lines shown? Would you want to see at what height in a building the 175 psi threshold would occur - on this graph? System demand and hose? I'm open to any and all ideas - in the end I think it'd be great if this tool was the quickest & best method for summarizing and analyzing fire pump output. Share your ideas in the comments here, thanks in advance! When conducting or reviewing hydraulic calculations, I very often face scenarios where the initial (very first) hydraulic demand exceeds the potential for the water supply. At that point I lose all hope and add a fire pump to the job. Just kidding, of course - there's at least a half dozen hydraulic elements I analyze and refine to better match the capabilities of the water supply to the design of the sprinkler system. Refining Hydraulic Calculations with K-Factors One of the more fine-tooth aspects I look at is the k-factor used on the sprinklers. The k-factor for a fire sprinkler is the discharge coefficient, or in normal human terms just relates to the amount of water that is permitted through the sprinkler. The k-factor is dependent upon the orifice diameter of the sprinkler - a low k-factor (such as K2.8) restricts the flow of water, while a larger k-factor (such as K22.4, K25.2, or K28.0) permit much more water to flow through. K-factors were originally created to be multiples of the discharge of a K5.6 sprinkler. A K2.8 sprinkler, for example, is 50% discharge of a K5.6 sprinkler, while a K11.2 sprinkler is 200% of the discharge of a K5.6. NFPA 13-2016 Table 6.2.3.1 shows this well.  Use In Design We find K5.6 sprinklers in light hazard all the time. Residential sprinklers often have k-factors less than 5.6. ESFR and CMSA require minimum K11.2 (NFPA 13-2016 6.2.3.5). ESFR are tied directly to the hazard it protects. Back to refining the hydraulics in a system - increasing the k-factor of a sprinkler allows more water to flow through a sprinkler with less pressure loss. This becomes very important when trying to reduce pressure loss in a system. Light Hazard Example A light hazard system (0.10 gpm/sqft) with widely spaced sprinklers (at 225 sqft each) would require a minimum flow through each sprinkler of 22.5 gpm (0.10 gpm/sqft x 225 sqft = 22.5 gpm). In order to flow 22.5 gpm, a sprinkler with a k-factor of 5.6 now requires 16.1 psi to do so (Q=k√p, or rearranged, p=(Q/k)^2). This is 9.1 psi higher than 7 psi, or the minimum that NFPA 13 requires. In order to flow 22.5 gpm, a sprinkler with k-factor of 8.0 only requires 7.9 psi to do so, or less than 1 psi more than the minimum NFPA 13 requires. In this scenario, flowing the same amount of water (22.5 gpm) results in a 8.2 psi difference in the pressure required at the most remote sprinkler. Can 8.2 psi be important? Absolutely! Other Scenarios Similarly, consider Ordinary Hazard Group 1 (0.15 gpm/sqft) and Ordinary Hazard Group 2 (0.20 gpm/sqft) systems. For Ordinary Hazard Group 1 and sprinklers spaced at 130 sqft, a K8.0 sprinkler requires 5.1 psi less than a K5.6 sprinkler (7.0 psi vs 12.1 psi). This same methodology applies to extended coverage sprinkler requirements, specific densities for traditional storage design, and more. The K-Factor Selector Want to quickly compare fire sprinkler k-factors across different design densities and sprinkler spacing? Easy. Here's the calculator I've created that quickly compares pressure requirements and flow rates across different sprinkler k-factors. 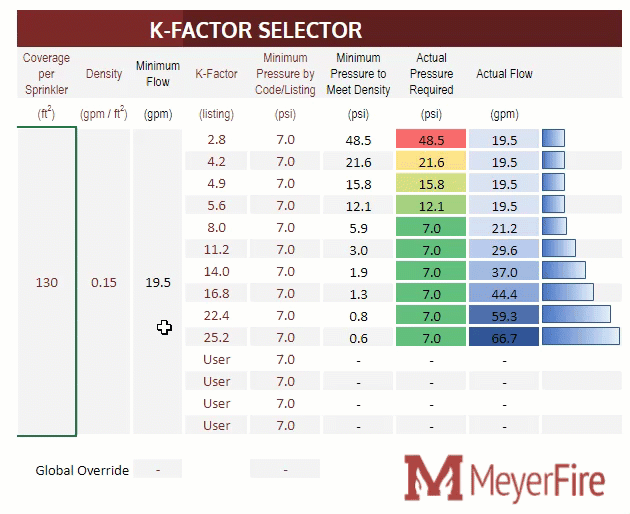 Toolkit Update Want all these tools in a downloadable, printable & PDF-saving capability? Great! The MeyerFire Toolkit will include this tool as well. You can download and try it out now through September for free. Sprinkler Database Other than the Toolkit, users of the comprehensive Fire Sprinkler Database can sort & search among k-factors as one of the parameters when comparing sprinklers. Please Share Do you get these articles & tools? If not, follow the fight for better fire protection by subscribing here. Know someone that might be interested in these tools or articles? Please do me a favor and send them a link or email to share these resources. Thanks!
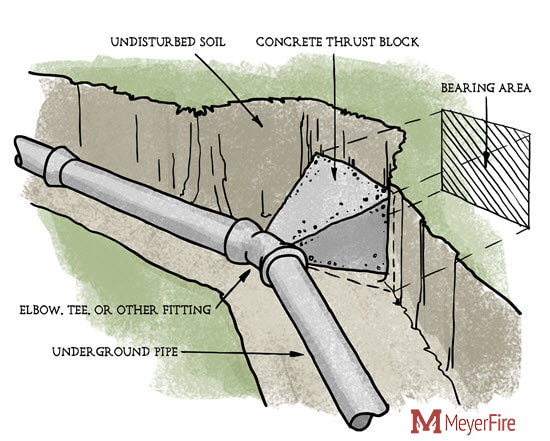
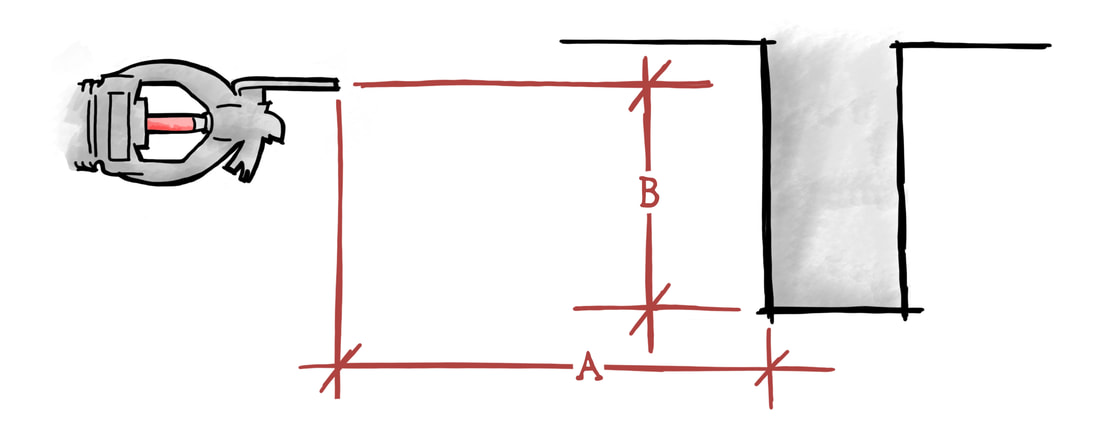
Last week I introduced a new Thrust Block Calculator and explored some of the concepts around the design and function of Thrust Blocks.
Expanded Calculator Here's the new expanded thrust block calculator. With similar inputs as before, we're now able to calculate the thrust block volume required, as well as determine the height and width required for the thrust block. Toolkit is Here Well it's here! The MeyerFire Toolkit is past a beta version and ready for you. 
Don't Get These Updates? You can subscribe to all the tools and resources we discuss and create by following the blog here: Join In As promised I've been busy developing all of the tools available from this site into a downloadable software package, where you can quickly run calculations, save, and print your work. I'm calling it the MeyerFire Toolkit. Here's the info page about the MeyerFire Toolkit.  The Toolkit is a downloadable software package with an assortment of basic tools for the fire protection professional. I have the software to a point now that I'd love to gather feedback from you - if you're interested.
If you'd like to beta test the software (try it out and poke around for free), please just reply to this email or shoot me a quick email at info@meyerfire.com letting me know you're interested. I'll send a link for a trial version of the software. While it would be great to get a gauge on where the software is now, I'm far more interested in where it can go in the coming months and couple years. I've been very encouraged by the interest and support to date and I think what these tools are now hardly scratches the surface of what could be developed to help fire protection professionals like you work faster and smarter. If you'd like to give it a try, all I ask is that you let me know your thoughts about it - usefulness, ways it can be improved, your level of interest - anything that might help build a better resource going forward. See more about it all here: MeyerFire Toolkit. Thank you!
After posting the N^1.85 Water Supply Graph a couple weeks ago, I was asked about creating an SI (International System of Units) version of the same graph for "those living on that side of the world."
I looked it up, and it turns out "that side of the world" is literally everyone except Liberia, Burma, and the United States. So for those across the pond or literally right next to us that don't use the ol' foot-candles system of measurement, here's the N^1.85 Fire Suppression Supply Graph in metric. Please give it a try and let me know your thoughts in the comments below. If you're relatively new to MeyerFire - welcome! This site and the tools here are created to help you create exceptional fire protection. I've worked in large companies with over 45 people dedicated fire protection staff and I've worked as a solo practitioner, and what I've found is that regardless of the work environment there is a big need for regular tools that can improve our workflow: tools with better analytics, tools to speed workflow, and tools that allow us to make better decisions. This site and the tools here are created for one purpose: to help you do exceptional work. They're created for the freelancer, the plan reviewer, the designer lost in the cubicle farm, the woman interrupted in meetings, the rookie, the mechanical who dabbles in fire protection, the intern, the ravenous learner, and the senior. Fire protection is too important to not do well. Here's a summary of tools available to date, with brief descriptions.
If you haven't already subscribed or shared this with someone who might be interested, please do. There are big plans for the website with new tools and resources that are already in development. Thanks for being a part of the story.
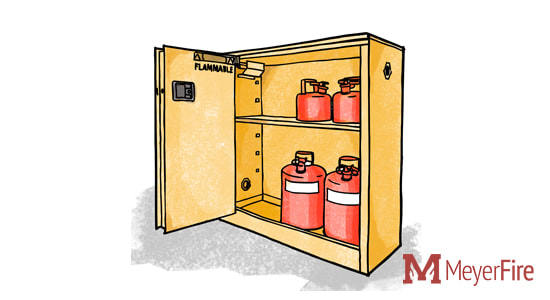
Occasionally I've been asked to look into storage quantities of flammable or combustible liquids.
This typically comes up in research and development facilities and laboratories, where the quantity of different liquid classifications becomes important. Liquid fires present a different challenge than pyrolysis of solids as the shape of the fire can change quickly and the speed of ignition can be significantly faster than fire growth of solids. 
Cabinets and sprinkler protection can contribute to increasing allowable storage quantities, but in order to do so, an evaluation must first be made to the different classifications for the liquids.
Many code and standard requirements depend on the classification of a Flammable or Combustible Liquid, such as storage locations, limits in quantity, limits in storage height, grouping, arrangement, whether control areas are necessary, and auxiliary requirements such as secondary containment and sprinkler densities. Where projects are subject to the International Fire Code, Chapter 34 (2003-2009 Editions) or Chapter 57 (2012-2018 Editions) begin to address these limitations and impacts. Where NFPA 30 (Flammable and Combustible Liquids Code) is applied, the entire standard sets precedents for these limitations and impact. This basic tool below is what I use to begin to assess and compile the classes and quantities for flammable and combustible liquids. Entering in only the Flash Point, Boiling Point, and quantity will identify and sum the totals that I can then use to assess against code and standard requirements. (If you don't see this tool above, click here to view) As I mentioned last week, I'm working towards a downloadable, printable software package where you can use all these tools on your own computer. It should help simplify and dramatically speed up using these tools. I hope to have this available by late May. Interested in seeing more articles like this, or want to stay in the loop with all the latest tools? Subscribe today.
A few weeks ago I received a call from a sprinkler contractor who needed to provide a water supply graph for a flow test he conducted.
I had a canned sheet I had developed for my own flow tests, but it was a basic graph that showed a curve and didn't match the traditional N^1.85 hydraulic graphs common for water supply curves. Since then I've tinkered and come up with an accurate chart that takes flow test input values, calculates total flow and draws the curve along the N^1.85 chart. 
The N^1.85 chart is particularly useful for fire suppression systems because the Hazen-Williams formula is based on the relationship that pressure relates to flow to the 1.85th power. 
When the x-axis, or the hydraulic flow is then scaled to the 1.85th power, hydraulic curves become straight lines which becomes easier to graph and compare. Prior to everyone carrying a computer in their pocket, these graphs were likely much easier to use for summaries and comparisons. The water supply information is what is provided as part of a two-hydrant flow test. The design input information would be the system demand side and can be used for quick comparisons. Personally, I only use this setup for flow test reports and water supply comparisons. Fire sprinkler hydraulic calculation software takes care of the graphs and outputs I need after I've completed the hydraulic calculations.
On a side note, I've had several people ask about getting access to all of the tools I've created to use on their own computer with the ability to produce printable output for record keeping. Thanks again to those who asked - these are available now as part of the MeyerFire Toolkit - a collection of all of our quick-hitting tools. The Toolkit is also included as part of MeyerFire University at no additional cost.
Don't get these free weekly articles? Subscribe here. My goal with creating this website and tools is to support those who want to create great fire protection.
If you coordinate upfront bid documents and are planning to have a dry sprinkler system on your project, you probably get the same question from electrical engineers as I do - how large will your compressor be?
It can be a difficult question to answer, considering there's multiple manufacturers and a handful of different options in choosing the right compressor for your project. NFPA 13 requires that a dry system have an air supply capable of restoring normal air pressure for the system within 30 minutes (NFPA 13 2002-2010 Section 7.2.6.2.2, 2013-2016 7.2.6.3.2). Fortunately, I've made a small update to the Sprinkler System Volume Calculator that indicates compressor sizes associated with your system volume. See the full tool here.
Do you get these weekly tools and articles via email? If not, subscribe here and get a free PDF guide for canopy and overhang requirements. |

ALL-ACCESS
SUBSCRIBEGet Free Articles via Email:
+ Get calculators, tools, resources and articles
+ Get our PDF Flowchart for Canopy & Overhang Requirements instantly 
+ No spam
+ Unsubscribe anytime AUTHORJoe Meyer, PE, is a Fire Protection Engineer out of St. Louis, Missouri who writes & develops resources for Fire Protection Professionals. See bio here: About FILTERS
All
ARCHIVES
May 2024
|


 RSS Feed